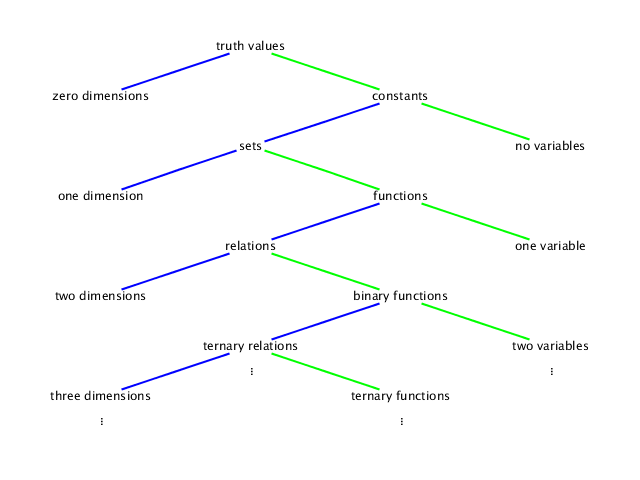
A truth value is either true or false; any statement with no variables in it, such as the statement that 0 < 2, should evaluate to true or false (in this case, true). To indicate that you are talking about the truth value of this statement, rather than asserting the statement itself, {0 < 2} is the truth value that 0 is less than 2 (which is the true truth value rather than the false one); there are other notations used for this. You can also use a variable to give a name to a truth value, so maybe p stands for {0 < 2}, although we won't need to do this.
A constant is, in this class, a real number, such as −2. Any expression with no variables should evaluate to a constant, but we use one dimension to graph a constant on a number line. Again, you can use a variable to stand for a constant, so maybe a stands for 2; in other words, a = −2.
A set is, in the simplest case, a set of real numbers. A statement with one variable defines a set, such as {x | x < 2}, the set of real numbers that are less than 2. We again use one dimension to graph a set. If A stands for the set {x | x < 2}, then these two statements mean the same thing:
A function, or unary function for emphasis, is a rule for taking a number (the input) and using it to calculate a number (the output). An example is (x ↦ x − 2), the rule which subtracts 2 from any number. To graph a function, we need two dimensions, one for the input and one for the output. If f stands for the function (x ↦ x − 2), then these two expressions mean the same thing:
A relation, or binary relation for emphasis, is a set of ordered pairs instead of a set of individual numbers. An example is {x, y | x + y < 2}. We again use two dimensions to graph a relation. If R stands for the relation {x, y | x + y < 2}, then these two statements mean the same thing:
A binary function, or function of two variables, is a rule for taking an ordered pair of two inputs and using it to calculate an output. An example is (x, y ↦ x + y − 2), the rule which subtracts 2 from the sum of the two inputs. To graph a binary function, we need three dimensions, two for the inputs and one for the output. If g stands for the function (x, y ↦ x + y − 2), then these two expressions mean the same thing:
A ternary relation, or relation between three variables, is a set of ordered triples instead of a set of ordered pairs. An example is {x, y, z | x + y + z < 2}. We again use three dimensions to graph a ternary relation.
A ternary function, or function of three variables, is a rule for taking an ordered triple of three inputs and using it to calculate an output. An example is (x, y, z ↦ x + y + z − 2), the rule which subtracts 2 from the sum of the three inputs. To graph a ternary function, we need four dimensions, three for the inputs and one for the output.
A quaternary relation, or relation between four variables, is a set of ordered quadruples. An example is {x, y, z, A | x + y + z + A < 2}. We again use four dimensions to graph a quaternary relation.
We can continue with quaternary functions, quinary functions, etc, which are functions of four or more variables; and we can continue with quinary relations, senary relations, etc, which are relations between five or more variables. (But around this point, most people stop using the ‘‑ary’ terms, because few people can remember them.)
The permanent URI of this web page
is
https://tobybartels.name/MATH-2080/2015SP/functions/.
![]()